pH → primary disorder → compensation → anion gap algorithm.
Schematic illustration, not a patient tracing.
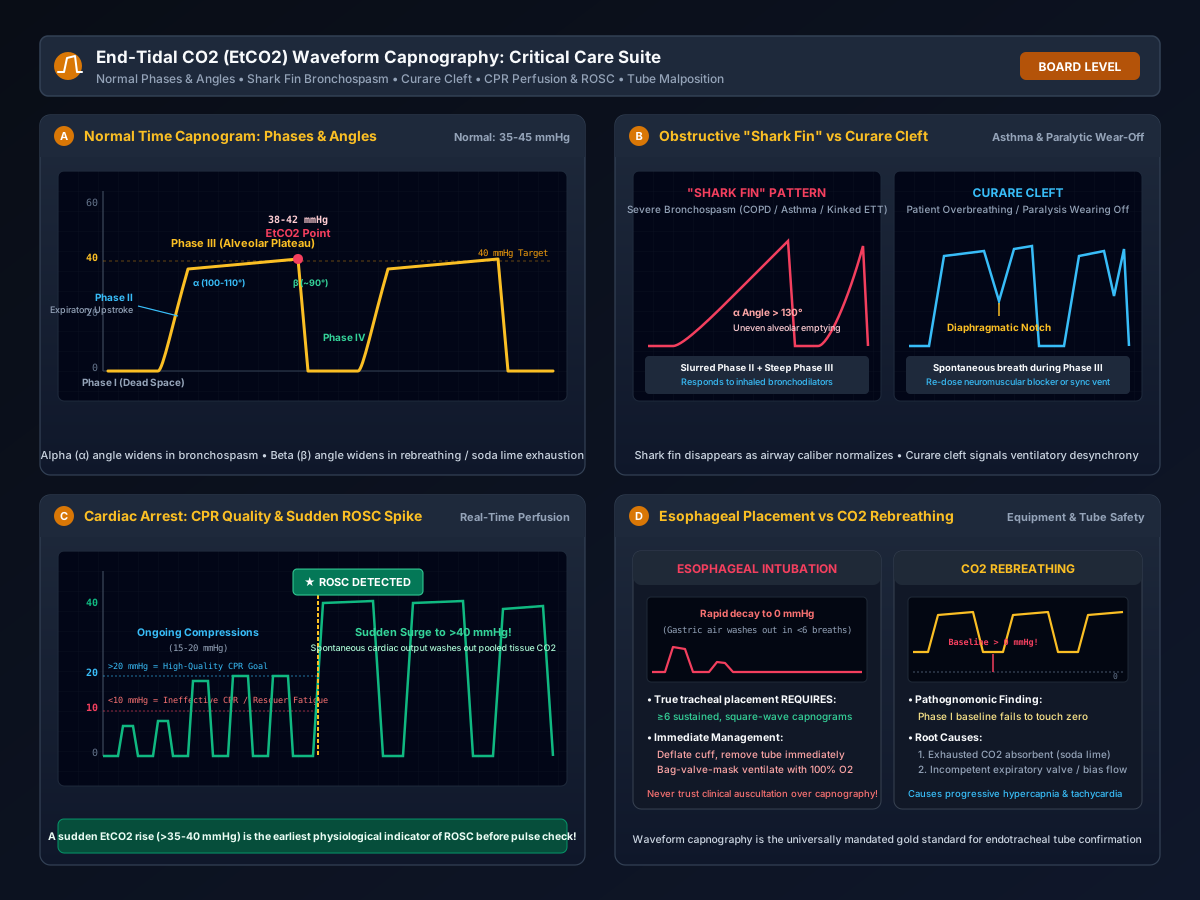
Four-panel critical care waveform capnography suite: (A) Normal time capnogram detailing Phases I through IV, alpha and beta angles, and the EtCO2 measuring point; (B) Obstructive 'shark fin' bronchospasm compared with curare cleft diaphragmatic twitches; (C) Cardiac arrest CPR compression monitoring showing poor quality (<10 mmHg), target quality (>20 mmHg), and sudden surge (>40 mmHg) diagnostic of ROSC; (D) Esophageal intubation rapid washout vs CO2 rebreathing with elevated baseline (>0 mmHg).
“Continuous Waveform Capnography: Normal Phases, Shark Fin Bronchospasm, CPR Perfusion, and Tube Safety” by ClinInterpret Medical Education Editorial Board — CC BY 4.0. View Full Image.
Common Pitfalls & Diagnostic Traps
- Relying on chest auscultation instead of waveform capnography to confirm endotracheal tube placement; auscultation can transmit gastric sounds into the thoracic wall, leading to fatal undetected esophageal intubations.
- Assuming an EtCO2 drop during CPR indicates worsening lung compliance; an EtCO2 <10 mmHg reflects inadequate chest compression depth, rescuer fatigue, or failed circulatory perfusion, requiring immediate compressor change.
- Equating End-Tidal CO2 directly with Arterial PCO2 (PaCO2) in patients with severe lung disease; while normally PaCO2 is 2-5 mmHg higher than EtCO2, massive dead space (ARDS, COPD, shock) dramatically widens the arterial-to-end-tidal CO2 gradient [P(a-ET)CO2].
- Missing soda lime exhaustion on anesthesia monitors by only watching the numerical EtCO2 value; always inspect the graphic baseline to ensure Phase I returns to absolute zero.
1Overview and Physiology
Continuous waveform capnography is the non-invasive, real-time graphical measurement of the partial pressure of carbon dioxide (PCO₂) in exhaled respiratory gas plotted against time or expired volume. It is universally established as the premier monitor of ventilation, pulmonary perfusion, and systemic cellular metabolism in intensive care, anesthesiology, and emergency medicine.
2The Tripod of Carbon Dioxide Kinetics
Carbon dioxide kinetics reflects the equilibrium of three distinct physiological processes:
- Metabolic Production ($\dot{V}\text{CO}_2$): Aerobic cellular respiration generates CO₂ as a byproduct of the Krebs cycle (~200 mL/min in resting adults). Hypermetabolic states (sepsis, malignant hyperthermia, shivering, seizures) increase production; hypometabolic states (hypothermia, deep sedation, brain death) reduce it.
- Circulatory Transport & Perfusion ($\dot{Q}$): CO₂ dissolves in plasma, binds hemoglobin as carbamino compounds, and converts to bicarbonate (HCO₃⁻) via erythrocyte carbonic anhydrase. Venous blood carries CO₂ to the pulmonary capillaries. If pulmonary blood flow ceases (cardiac arrest, massive pulmonary embolism), CO₂ cannot reach the lungs, and expired EtCO₂ rapidly drops toward zero.
- Alveolar Ventilation ($\dot{V}_A$): Across the alveolar-capillary membrane, CO₂ diffuses rapidly into alveoli down a steep concentration gradient (45 mmHg mixed venous to 40 mmHg alveolar). The rate of alveolar gas clearance determines alveolar PCO₂:
$PACO₂ ≈ frac{dot{V}CO₂}{dot{V}_A} Hypoventilation causes \text{CO}_2 retention and elevated \text{EtCO}_2; hyperventilation washes out alveolar gas, depressing \text{EtCO}_2$.
3Recording and Calibration
Capnography instruments utilize Non-Dispersive Infrared (NDIR) Spectroscopy. Because heteronuclear gas molecules like CO₂ absorb infrared radiation at a specific absorption wavelength of 4.26 µm, the attenuation of transmitted infrared light across a gas sample chamber directly correlates with carbon dioxide concentration via the Beer-Lambert law.
4Mainstream vs Sidestream Analyzers
$begin{array}{|l|l|l|} hline textbf{Parameter} & textbf{Mainstream Capnography} & textbf{Sidestream Capnography} \ hline Sensor Location & Heated cuvette placed directly at airway adapter & Remote sensor inside monitor; gas aspirates via tubing \ Aspiration Rate & Zero (no gas removed) & 50--150 mL/min \ Response Time & text{Instantaneous (<50\ \text{ms}, zero transport lag)} & text{Delayed by 1\text{--}2\ \text{seconds} (transit delay)} \ Patient Types & Intubated ICU/OR patients only & Intubated AND non-intubated (nasal prongs with oral scoop) \ Vulnerabilities & Heavy sensor adds circuit drag; fragile face plate & Moisture/secretions can occlude sampling line/trap \ hline end{array}$
5Technical Calibration & Checks
- Zero Calibration (Room Air Zeroing): The sensor must zero against ambient room air (0.04% CO₂ ≈ 0.3 mmHg), verifying that Phase I touches absolute zero.
- Moisture Trap & Dehydration Filter: Sidestream sampling tubing must utilize hydrophobic water traps and nafion tubing to prevent condensation from blocking infrared transmission.
- Temperature Compensation: Gas temperature within the cuvette is electronically stabilized to 40^°C to prevent water vapor condensation and pressure broadening effects.
6Normal Pattern
A normal time-based capnogram displays a crisp, rectangular waveform with four distinct phases across every respiratory cycle:
    PCO2 (mmHg)
     50 ┬
        │                         Phase III (Alveolar Plateau)
     40 ┼ - - - - - - - - - - - - - - - - - - - - - - - - - - - ╢ EtCO2 Point (35-45 mmHg)
        │                             ╭─────────────────────────╯│
     30 ┼                            ╱  (Alpha Angle 100-110°)   │
        │                           ╱                            │
     20 ┼                          ╱                             │
        │             Phase II    ╱                              │ Phase IV
     10 ┼      (Expiratory       ╱                               │ (Inspiratory
        │       Upstroke)       ╱                                │  Downstroke)
      0 ┴──────────────────────╯                                 ╰──────────────────
Phase I (Dead Space) Next Breath- Phase I (Inspiratory Baseline): Exhalation begins with clearance of apparatus and anatomical dead space gas (conducting airways: mouth, pharynx, trachea). Because no gas exchange occurs here, PCO₂ is zero (0 mmHg).
- Phase II (Early Expiratory Upstroke): Rapid S-shaped ascent as anatomical dead space gas mixes with rich carbon dioxide exiting alveolar compartments.
- Phase III (Alveolar Plateau): Exhalation of pure alveolar gas. Due to differences in ventilation-perfusion ratios (dot{V}/dot{Q}) across upper and lower lung zones, the plateau slopes gently upward. The terminal peak of Phase III represents the true End-Tidal $\text{CO}_2$ ($\text{EtCO}_2$) value.
- Phase IV (Inspiratory Downstroke): Immediate, precipitous return of the tracing to the zero baseline as fresh inspiratory gas enters the airway.
- Alpha Angle ($\alpha$): The angle between Phase II and Phase III (normally 100^°--110^°). It broadens significantly (>120^°) when airway resistance is elevated (bronchospasm).
- Beta Angle ($\beta$): The angle between the alveolar plateau (Phase III) and descending limb (Phase IV), normally approximately 90^°. It widens in carbon dioxide rebreathing.
7Measurement Method
- Numerical Reference Interval:
- Normal resting EtCO₂ in a healthy adult breathing room air: $35\text{--}45\ \text{mmHg}$ (4.6--6.0 kPa).
- Arterial-to-End-Tidal Gradient [$\text{P(a-ET)CO}_2$]:
- In healthy individuals with normal lung parenchyma and cardiac output, arterial PCO₂ (PaCO₂) slightly exceeds EtCO₂ by $2\text{--}5\ \text{mmHg}$, reflecting physiological dead space.
- In severe acute lung injury, ARDS, pulmonary embolism, or hemorrhagic hypoperfusion, physiological dead space expands dramatically, causing the gradient to widen to 15--30 mmHg. In such cases, EtCO₂ will underestimate PaCO₂ significantly.
8Indications
- Mandatory Endotracheal Tube Verification: Conclusively confirming tracheal placement versus fatal esophageal intubation (standard of care across all international resuscitation guidelines).
- Cardiopulmonary Resuscitation (ACLS): Real-time objective quantification of closed-chest compression efficacy and earliest detection of Return of Spontaneous Circulation (ROSC).
- Procedural Sedation Monitoring: Earliest detection of hypoventilation, airway obstruction, or central respiratory arrest (detects apnea minutes before pulse oximetry desaturates).
- Mechanical Ventilation Optimization: Non-invasive titration of minute ventilation in acute brain injury to prevent pathological intracranial vasoconstriction (EtCO₂ < 30 mmHg) or rebound intracranial hypertension (EtCO₂ > 45 mmHg).
- Detection of Bronchospasm & Airway Obstruction: Continuous monitoring of response to bronchodilators in asthma and COPD exacerbations.
9Systematic Interpretation Steps
Step 1: Check Baseline (Phase I)
   ├─ Does the baseline touch absolute zero (0 mmHg)?
   └─ If baseline > 0 mmHg: Diagnose CO2 Rebreathing (exhausted soda lime or valve failure)

Step 2: Inspect Expiratory Upstroke (Phase II) & Alpha Angle
   ├─ Is the upstroke steep and clean?
   └─ If slurred / delayed with widened alpha angle: Diagnose Obstructive "Shark Fin" (bronchospasm)

Step 3: Evaluate Alveolar Plateau (Phase III) & Curare Clefts
   ├─ Is the plateau horizontal or gently upsloping?
   ├─ Check for dips or notches: Curare Cleft indicates patient breathing against ventilator
   └─ Read the terminal peak: Note the exact numerical EtCO2 value

Step 4: Check Inspiratory Downstroke (Phase IV)
   ├─ Is the drop to baseline immediate and vertical?
   └─ Prolonged downstroke indicates inspiratory valve incompetence or circuit leak

Step 5: Correlate Numerical EtCO2 with Hemodynamics and ABG
   ├─ EtCO2 35-45 mmHg: Normocapnia
   ├─ EtCO2 > 45 mmHg: Hypoventilation, hyperthermia, or excessive bicarbonate infusion
└─ EtCO2 < 30 mmHg: Hyperventilation, massive dead space (PE), or shock/low cardiac output10Abnormal Patterns and Differential Diagnosis
$begin{array}{|l|l|l|} hline textbf{Waveform Morphology} & textbf{Pathognomonic Finding} & textbf{Etiology & Clinical Action} \ hline textbf{Shark Fin Pattern} & Slurred Phase II, loss of alpha angle, steep Phase III & Severe bronchospasm (asthma/COPD) or tube kink; give bronchodilators \ textbf{Curare Cleft} & Sharp notch in terminal third of Phase III & Patient fighting vent / paralytics wearing off; deepen sedation \ textbf{Elevated Baseline (>0)} & Phase I fails to reach 0 mmHg & CO2 Rebreathing; replace exhausted soda lime or check expiratory valve \ textbf{Decaying Small Waves} & text{Fewer than 6 waves of <5\text{ mmHg} decaying to 0} & Esophageal Intubation; immediate extubation and bag ventilation \ textbf{Sudden Drop to Zero} & Instant disappearance of waveform & Circuit disconnection, extubation, complete tube obstruction, vent failure \ textbf{Sudden Stepdown (>20)} & Abrupt drop with maintained waveform shape & Massive Pulmonary Embolism, severe acute blood loss, acute cardiac arrest \ textbf{Sudden Jump (>35)} & Abrupt elevation during CPR compressions & Return of Spontaneous Circulation (ROSC); pause compressions for pulse \ hline end{array}$
11Limitations and Pitfalls
- Dead Space Discrepancy: In patients with severe emphysema, pulmonary embolism, or low cardiac output, EtCO₂ is significantly lower than arterial PaCO₂. Never assume normal EtCO₂ guarantees normal PaCO₂ in cardiogenic shock.
- Colorimetric Indicator Limitations: Chemical colorimetric litmus paper detectors (purple to yellow) can give false-positive readings if contaminated with gastric acid or adrenaline, and false-negative readings in low-cardiac-output arrest. Continuous infrared waveform capnography is significantly superior.
- Moisture and Secretion Clogging: Sidestream sampling lines can occlude with condensed humidity or mucus, creating pseudo-damped tracings or false 'apnea' alarms.
12Critical Findings and Red Flags
> [!CAUTION] > Emergency Escalation Triggers: > 1. Absence of Rectangular Waveforms Post-Intubation: Assume esophageal intubation until proven otherwise. Remove endotracheal tube immediately if ≥ 6 consistent waveforms cannot be verified. > 2. Sudden Drop in EtCO2 to $<10\ \text{mmHg}$ During Resuscitation: Signals ineffective chest compressions or acute compressor fatigue. Switch chest compressors immediately. > 3. Sudden Rise in EtCO2 to $>35\text{--}40\ \text{mmHg}$ During Active CPR: Represents the hallmark of ROSC. Withhold further chest compressions and verify central arterial pulse and blood pressure.
13Exam Pearls
- The Six-Breath Rule: Carbonated beverages or gastric air can produce 2 to 4 small capnographic deflections in the esophagus, but cannot sustain CO₂ delivery. Verification of endotracheal placement requires at least 6 consecutive, uniform, high-amplitude waveforms.
- The Earliest Indicator of ROSC: During cardiac arrest resuscitation, a sudden surge in EtCO₂ precedes the return of a palpable pulse by 15--30 seconds, because restored cardiac output immediately flushes accumulated peripheral CO₂ back to the pulmonary bed.
- The Alpha Angle Pearl: The α angle reflects ventilation kinetics; the β angle reflects equipment integrity. A wide α angle means the lungs are obstructed; a wide β angle means the machine is rebreathing.
Related Investigations & Companion Tests
Attributed Textbooks & Clinical Guidelines
- Marino PL. Marino's The ICU Book. 4th ed. Wolters Kluwer Health/Lippincott Williams & Wilkins, 2014
- Panchal AR et al. 2020 American Heart Association Guidelines for Cardiopulmonary Resuscitation and Emergency Cardiovascular Care: Adult Basic and Advanced Life Support. Circulation. 2020;142(16_suppl_2):S366-S468
- Bhavani-Shankar K et al. Capnometry and Anaesthesia. Can J Anaesth. 1992;39(6):617-632
- Cook TM et al. Major complications of airway management in the UK: results of the Fourth National Audit Project of the Royal College of Anaesthetists and the Difficult Airway Society. Part 1: anaesthesia. Br J Anaesth. 2011;106(5):617-631
What are the four distinct phases of a normal time-based capnogram tracing?
Notes & Highlights
Saved locally onlyA 45-year-old trauma patient undergoes rapid sequence intubation (RSI) in the emergency department. Following endotracheal tube insertion and cuff inflation, the colorimetric CO2 detector turns faintly yellow for two breaths and then remains dark purple. Continuous sidestream waveform capnography reveals three low-amplitude rounded waveforms of 4 mmHg that rapidly decay to a flat horizontal line at 0 mmHg. Bilateral breath sounds are faintly heard over the anterior chest. What is the diagnosis and required immediate action?
A 62-year-old female in the intensive care unit is mechanically ventilated for severe ARDS. The baseline EtCO2 tracing displays a normal rectangular profile with an EtCO2 value of 42 mmHg. Suddenly, over a 15-second window, the EtCO2 drops abruptly from 42 mmHg to 12 mmHg, while arterial oxygen saturation drops from 95% to 81%, and blood pressure falls from 120/75 mmHg to 65/38 mmHg. Ventilator peak inspiratory pressures remain unchanged. What catastrophic pulmonary event explains this abrupt physiological decoupling?
During general anesthesia for an elective abdominal procedure, the anesthesiologist notices that the capnography tracing shows an elevated baseline where Phase I fails to return to zero, resting consistently at 8 to 10 mmHg. Phase III reaches 48 mmHg. Over the subsequent 20 minutes, the patient develops tachycardia (HR 105 bpm) and blood pressure increases from 115/70 to 148/92 mmHg. What is the physical cause of this capnographic abnormality?