Rise/fall curves for troponin vs CK-MB vs myoglobin after infarction.
Schematic illustration, not a patient tracing.
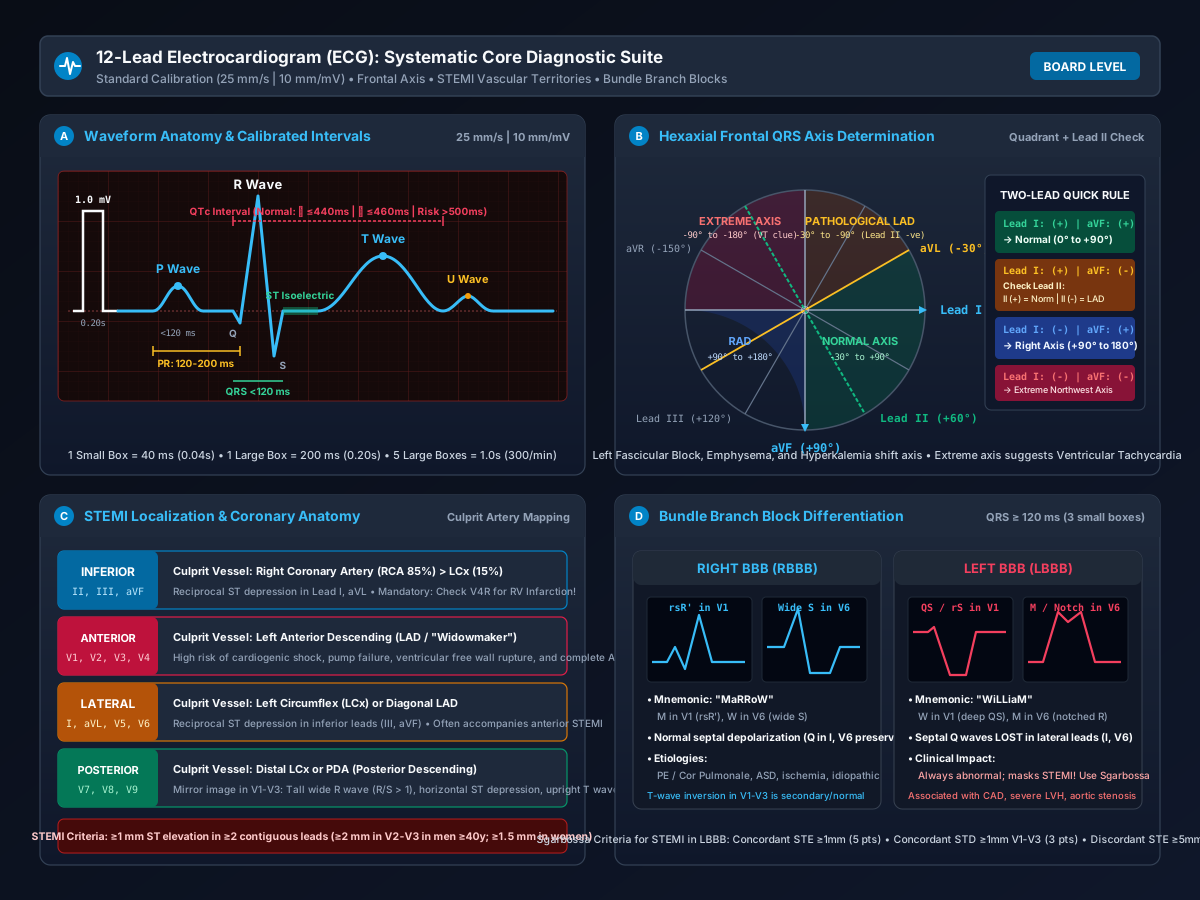
Four-panel comprehensive 12-lead ECG diagnostic suite: (A) Calibrated ECG grid and waveform intervals (P, PR, QRS, ST, T, U, QTc); (B) Hexaxial reference circle and rapid 2-lead axis determination; (C) STEMI coronary arterial localization table (Inferior RCA, Anterior LAD, Lateral LCx, Posterior); (D) Bundle branch block morphological differentiation (RBBB vs LBBB with Sgarbossa criteria).
“12-Lead ECG: Systematic Waveform Anatomy, Frontal Axis, STEMI Mapping, and Bundle Branch Blocks” by ClinInterpret Medical Education Editorial Board — CC BY 4.0. View Full Image.
Common Pitfalls & Diagnostic Traps
- Reading an ECG tracing without first checking paper speed (25 vs 50 mm/s) and voltage calibration (10 mm/mV), leading to gross miscalculations of heart rate and ventricular hypertrophy.
- Confusing Left Arm / Right Arm (LA-RA) cable reversal with true dextrocardia; limb reversal displays normal V1-V6 precordial R-wave progression, while true dextrocardia shows absent precordial progression.
- Diagnosing Left Axis Deviation based solely on a negative aVF without checking Lead II; if Lead II is positive, the axis is normal (between 0° and -30°).
- Measuring the QT interval including a prominent U wave, causing severe overestimation of QTc and inappropriate cessation of antiarrhythmic medications.
1Overview and Physiology
The 12-lead Electrocardiogram (ECG / EKG) is the non-invasive recording of myocardial electrical potential gradients generated by cardiac depolarization and repolarization across the cardiac cycle, detected by skin surface electrodes and plotted over time on calibrated grid paper.
2Electrophysiological Foundation of the ECG Tracing
Every cardiac contraction begins with spontaneous Phase 4 diastolic depolarization within pacemaker cells of the Sinoatrial (SA) Node located in the high lateral right atrium. The electrical wavefront propagates through atrial myocardium to the Atrioventricular (AV) Node, where conduction is slowed by ~0.1 second to permit ventricular diastolic filling. The impulse then accelerates through the Bundle of His, bifurcates into the Right and Left Bundle Branches (and anterior/posterior left fascicles), and rapidly arborizes through the subendocardial Purkinje fiber network, initiating endocardial-to-epicardial ventricular depolarization.
- P Wave: Represents right and left atrial depolarization (duration < 120 ms, amplitude < 2.5 mm in lead II).
- PR Segment & Interval: The PR interval (120–200 ms) reflects time from the onset of atrial activation to the beginning of ventricular depolarization, capturing physiological AV nodal conduction delay.
- QRS Complex: Represents ventricular depolarization (< 120 ms). Because left ventricular muscle mass exceeds right ventricular mass by 3:1, the normal mean electrical vector points downward and leftward.
- ST Segment: Represents the plateau phase (Phase 2) of the ventricular action potential, during which all ventricular myocardium is uniformly depolarized and electrical potential gradients are zero (isoelectric baseline).
- T Wave: Represents ventricular repolarization (Phase 3). Repolarization proceeds from epicardium to endocardium (reverse of depolarization); hence, the normal T wave is concordant with the QRS complex.
- U Wave: Small (< 1–2 mm) positive wave following the T wave, representing repolarization of mid-myocardial "M-cells" or Purkinje fibers.
3Recording and Calibration
A standard diagnostic ECG requires verification of three foundational technical parameters before clinical interpretation begins:
- Paper Speed: International standard speed is $25\ \text{mm/second}$.
- 1 small square (1 mm) = 0.04 seconds (40 ms).
- 1 large square (5 small squares / 5 mm) = 0.20 seconds (200 ms).
- 5 large squares = 1.0 second; 300 large squares = 1 minute.
Warning: In certain European centers, paper speed is set to 50 mm/s to evaluate complex arrhythmias. At 50 mm/s, all intervals appear twice as wide, falsely mimicking bundle branch block!
- Voltage Calibration: Standard sensitivity is $10\ \text{mm/mV}$.
- Indicated by a rectangular calibration pulse at the beginning or end of the tracing: exactly 10 mm high (2 large boxes) and 5 mm wide.
- Half-standard (5 mm/mV): used in massive LVH to keep giant QRS complexes on the paper.
- Double-standard (20 mm/mV): used in low-voltage recordings to amplify tiny waves.
- Electrode Placement (The 12 Leads):
- Bipolar Limb Leads (Einthoven): Lead I (RA- to LA+), Lead II (RA- to LL+), Lead III (LA- to LL+).
- Unipolar Augmented Limb Leads (Goldberger): aVR (Right arm), aVL (Left arm), aVF (Left foot).
- Precordial Horizontal Leads (Wilson):
- V1: 4th intercostal space (ICS) at right sternal border.
- V2: 4th ICS at left sternal border.
- V3: Midway between V2 and V4.
- V4: 5th ICS in the left midclavicular line.
- V5: Horizontal to V4 in the left anterior axillary line.
- V6: Horizontal to V4 in the left midaxillary line.
4Normal Pattern
A normal, healthy resting adult 12-lead ECG demonstrates:
- Normal Sinus Rhythm: Consistent upright P waves in leads I, II, and aVF with uniform morphology preceding every QRS complex at a rate of 60 to 100 bpm.
- Frontal Electrical Axis: Normal between -30^° and +90^° (QRS positive in leads I and II).
- Normal Intervals:
- PR interval: 120–200 ms (3 to 5 small squares).
- QRS duration: 70–100 ms (< 120 ms).
- QTc interval (Bazett): < 440 ms in males, < 460 ms in females.
- Normal Precordial R-Wave Progression: Small r wave with deep S wave in V1, with R wave amplitude progressively increasing and S wave diminishing across leads V2 to V5. Transition zone (where R wave height equals S wave depth) normally occurs at lead V3 or V4.
- Normal T Waves: Upright in leads I, II, V3–V6; inverted in aVR; variable in III, aVL, V1, V2.
5Measurement Method
Precise calculation of ECG intervals requires standardized measurement landmarks:
- Rate Calculation:
- Regular Rhythms: Count large boxes between two consecutive R waves:
$Heart Rate = frac{300}{Number of Large Squares} Alternatively, for exact calculation: 1500 / (\text{Number of Small Squares})$.
- Irregular Rhythms (Atrial Fibrillation): Count total R waves in a 10-second rhythm strip (50 large boxes) and multiply by 6.
- Frontal Plane QRS Axis Determination (The Two-Lead Quadrant Method):
- Inspect Lead I and Lead aVF.
- If Lead I is positive (+) and aVF is positive (+) → Normal Axis ($0^\circ$ to $+90^\circ$).
- If Lead I is positive (+) and aVF is negative (-) → Possible Left Axis Deviation ($0^\circ$ to $-90^\circ$). Inspect Lead II: If Lead II is positive, axis is normal (0^° to -30^°). If Lead II is negative, axis is true Pathological Left Axis Deviation ($-30^\circ$ to $-90^\circ$).
- If Lead I is negative (-) and aVF is positive (+) → Right Axis Deviation ($+90^\circ$ to $+180^\circ$).
- If Lead I is negative (-) and aVF is negative (-) → Extreme Northwest Axis ($-90^\circ$ to $-180^\circ$).
- QT Interval Rate Correction (Bazett's Formula):
$QTc = frac{QT (measured in seconds)}{√{R-R interval (in seconds)}}$ Measurement rule: Measure QT from the earliest onset of the QRS complex to the point where the downslope of the T wave intersects the isoelectric TP baseline (the "tangent method"). Exclude U waves.
6Indications
- Acute Chest Discomfort: Evaluating acute coronary syndromes (STEMI, NSTEMI, unstable angina, pericarditis).
- Arrhythmias & Palpitations: Diagnosing tachycardias (SVT, AF, VT) and bradycardias (sinus pause, AV block).
- Syncope & Presyncope: Unmasking channelopathies (Long QT, Brugada, WPW), conduction system failure, or high-grade heart block.
- Dyspnea & Respiratory Distress: Identifying acute cor pulmonale / right heart strain (pulmonary embolism) or acute pulmonary edema.
- Systemic Metabolic & Electrolyte Disturbances: Severe hyperkalemia (peaked T, sine wave), hypokalemia (U waves), or hypocalcemia (QT prolongation).
- Pre-Operative Risk Assessment & Drug Safety: Screening baseline conduction before initiating QT-prolonging psychotropics or antiarrhythmics.
7Systematic Interpretation Steps
┌─────────────────────────────────────────────────────────────┐
│          7-STEP SYSTEMATIC ECG INTERPRETATION PROTOCOL      │
├─────────────────────────────────────────────────────────────┤
│ Step 1: Technical & Calibration Check                       │
│         Verify speed (25 mm/s), voltage (10 mm/mV), and     │
│         check lead placement (Lead aVR should be negative;  │
│         if aVR is positive, suspect arm lead reversal!).    │
├─────────────────────────────────────────────────────────────┤
│ Step 2: Rate and Rhythm Analysis                            │
│         ├─ Rate: Normal (60 - 100), Brady (< 60), Tachy (> 100)│
│         ├─ Regularity: Regular, regularly irregular, or     │
│         │  irregularly irregular (Atrial Fibrillation)      │
│         └─ Sinus Origin: Upright P wave in II, III, aVF;    │
│            every P followed by a QRS; every QRS preceded by P│
├─────────────────────────────────────────────────────────────┤
│ Step 3: Frontal Plane QRS Axis                              │
│         Examine Leads I, II, and aVF:                       │
│         Normal (-30° to +90°), LAD (-30° to -90°),          │
│         RAD (+90° to +180°), Extreme Axis (-90° to -180°)   │
├─────────────────────────────────────────────────────────────┤
│ Step 4: Interval Measurements                               │
│         ├─ PR Interval: 120 - 200 ms (Short = WPW; Long =   │
│         │  1st-degree AV block)                             │
│         ├─ QRS Duration: < 120 ms (Wide >= 120 ms: RBBB,    │
│         │  LBBB, Ventricular Pacing, or Ventricular Rhythm) │
│         └─ QTc: <= 440 ms (M), <= 460 ms (F) (Long > 500 ms)│
├─────────────────────────────────────────────────────────────┤
│ Step 5: Hypertrophy & Chamber Enlargement                   │
│         ├─ P-pulmonale: P wave > 2.5 mm in II (Right Atrial)│
│         ├─ P-mitrale: Broad notched P > 120 ms (Left Atrial)│
│         ├─ LVH: Sokolow-Lyon (S in V1 + R in V5/V6 >= 35 mm)│
│         └─ RVH: R/S ratio > 1 in V1 + Right Axis Deviation  │
├─────────────────────────────────────────────────────────────┤
│ Step 6: ST Segment and T Wave Morphology (Ischemia/Infarct) │
│         Inspect contiguous leads for ST-Elevation (STEMI) or│
│         ST-Depression / T-wave inversion (Ischemia):        │
│         ├─ Inferior: Leads II, III, aVF (RCA / LCx)         │
│         ├─ Septal: Leads V1, V2 (LAD)                       │
│         ├─ Anterior: Leads V3, V4 (LAD)                     │
│         └─ Lateral: Leads I, aVL, V5, V6 (LCx / LAD)        │
├─────────────────────────────────────────────────────────────┤
│ Step 7: Final Synthesis & Comparison with Prior ECGs        │
│         Compare present findings against historical baseline│
│         to determine acute versus chronic abnormalities.    │
└─────────────────────────────────────────────────────────────┘8Abnormal Patterns and Differential Diagnosis
91. Ventricular Conduction Abnormalities
| Conduction Defect | Defining ECG Criteria | Clinical Associations |
|---|---|---|
| Right Bundle Branch Block (RBBB) | QRS ≥ 120 ms; M-shaped $\text{rsR}'$ or "rabbit ears" in V1–V3; wide slurred S wave in lateral leads I and V6 | Pulmonary embolism, cor pulmonale, ASD, ischemic heart disease, or normal variant |
| Left Bundle Branch Block (LBBB) | QRS ≥ 120 ms; broad, notched monophasic R wave in I, aVL, V5, V6; deep broad QS complex in V1–V2; absence of septal Q waves in I and V6 | Severe structural heart disease (CAD, dilated cardiomyopathy, aortic stenosis). Precludes standard STEMI criteria (use Sgarbossa criteria) |
| Left Anterior Fascicular Block (LAFB) | Marked Left Axis Deviation (-45^° to -90^°); small q with tall R in I/aVL; small r with deep S in II, III, aVF; normal QRS duration (< 120 ms) | Ischemic heart disease, hypertensive cardiomyopathy, degenerative conduction sclerosis |
| Left Posterior Fascicular Block (LPFB) | Marked Right Axis Deviation (+90^° to +180^°); small r with deep S in I/aVL; small q with tall R in III/aVF; rule out RVH/PE | Rare; extensive ischemic involvement of the posterior fascicle |
102. Pre-Excitation (Wolff-Parkinson-White Syndrome)
- Short PR interval (< 120 ms).
- Slurred, slowly rising upstroke of the QRS complex (Delta wave), representing premature ventricular activation via an accessory pathway (Bundle of Kent) bypassing the AV node.
- Secondary widening of the QRS complex (> 120 ms) with discordant secondary ST-T changes.
11Limitations and Pitfalls
- The "Lead Reversal" Trap:
- Left Arm / Right Arm (LA-RA) Reversal: Inverts Lead I, switches Leads II and III, switches aVR and aVL. Look at Lead aVR: in normal anatomy, aVR is always negative. An upright positive P-QRS-T in lead aVR with an inverted Lead I is LA-RA reversal until proven otherwise!
- Precordial Lead Misplacement: Placing V1 and V2 too high (2nd or 3rd ICS) mimics Brugada syndrome or anterior infarction; placing V4–V6 too low causes false loss of R-wave progression.
- The "Normal ECG" in Acute Coronary Syndrome: Up to 15% to 20% of patients with acute myocardial infarction have a completely normal initial ECG! A normal ECG never excludes ACS in a patient with ongoing ischemic symptoms; serial tracings every 15 to 30 minutes are mandatory.
- The Bazett Formula Tachycardia Overcorrection: Bazett's formula overcorrects QTc at rapid heart rates (> 100 bpm), falsely diagnosing Long QT, and undercorrects at bradycardia (< 50 bpm). At extreme heart rates, use the Fridericia ($\text{QT} / \sqrt[3]{\text{RR}}$) or Framingham linear regression formulas.
12Critical Findings and Red Flags
| ECG Finding | Clinical Emergency | Immediate Action |
|---|---|---|
| ST Elevation $\ge 1\ \text{mm}$ in $\ge 2$ Contiguous Leads | Acute STEMI | Immediate cardiac cath lab activation for primary PCI; aspirin 300 mg + P2Y12 inhibitor load. |
| Wide Complex Tachycardia (QRS $\ge 120\ \text{ms}$, Rate $> 120$) | Ventricular Tachycardia (VT) until proven otherwise | If unstable: emergency synchronized DC cardioversion. If stable: IV amiodarone or procainamide; do NOT give verapamil or adenosine! |
| Biphasic / Sine Wave Pattern with Wide QRS | Severe Lethal Hyperkalemia | IV 10% Calcium Gluconate (10–20 mL) immediately over 2–5 minutes; insulin/dextrose; salbutamol. |
| QTc $> 500\ \text{ms}$ with Frequent PVCs / 'R-on-T' Phenomenon | Impending Torsades de Pointes | Stop all QT-prolonging drugs; IV Magnesium Sulfate 2 g over 10 minutes; overdrive pacing if bradycardic. |
| Third-Degree (Complete) AV Block with Ventricular Escape | Complete Heart Block | Transcutaneous pacing pads placed immediately; IV atropine / dopamine; prepare for transvenous pacemaker. |
13Exam Pearls
- The aVR Rule of Thumb: If Lead aVR has an upright P wave and an upright QRS, it is either:
- Limb Lead Reversal (LA-RA cables swapped) → normal V1-V6 progression.
- Dextrocardia → inverted precordial R-wave progression (tallest in V1, flat in V6).
- The "Sokolow-Lyon" LVH Index:
$S wave in V1 + R wave in V5 or V6 ≥ 35 mm Or R wave in aVL \ge 11\ \text{mm}$.
- S1Q3T3 in Pulmonary Embolism (McGinn-White Sign): Deep S wave in Lead I, pathological Q wave in Lead III, and inverted T wave in Lead III. Present in only 15–20% of PE cases, but highly specific for acute cor pulmonale. The most common ECG finding in PE is simple sinus tachycardia.
Related Investigations & Companion Tests
Attributed Textbooks & Clinical Guidelines
- Surawicz B et al. AHA/ACCF/HRS Recommendations for the Standardization and Interpretation of the Electrocardiogram. Circulation. 2009;119(10):e235-e240
- Goldberger AL et al. Goldberger's Clinical Electrocardiography: A Simplified Approach. 9th ed. Elsevier, 2017
- Harrison's Principles of Internal Medicine, 21st Edition
What are standard ECG calibration settings, and how do they translate to time and voltage?
Notes & Highlights
Saved locally onlyA 55-year-old male presents with palpitations. A 12-lead ECG is recorded at standard 25 mm/s speed. The rhythm is regular. The distance between consecutive R waves across the precordial leads is exactly 4 large boxes. Lead I shows a predominantly positive QRS (+8 mm), Lead aVF shows a predominantly negative QRS (-6 mm), and Lead II shows an upright, positive QRS (+4 mm). What are the calculated heart rate and frontal plane QRS axis?
A 24-year-old female medical student reviews an outpatient ECG. Standard calibration marks reveal the calibration pulse at the beginning of the tracing is 5 mm high (instead of standard 10 mm). Lead I displays negative P waves, negative QRS complexes, and inverted T waves, while lead aVR shows positive P waves and upright QRS complexes. Precordial lead V1 through V6 progression is completely normal. What is the technical cause of these findings?
A 48-year-old female on citalopram and ondansetron is admitted for syncopal episodes. Baseline ECG shows sinus rhythm at 60 bpm with an R-R interval of exactly 1.0 second (1,000 ms). The measured QT interval from the start of the QRS to the end of the T wave is 540 ms. What is the calculated QTc (Bazett), and what arrhythmia risk is present?