pH → primary disorder → compensation → anion gap algorithm.
Schematic illustration, not a patient tracing.
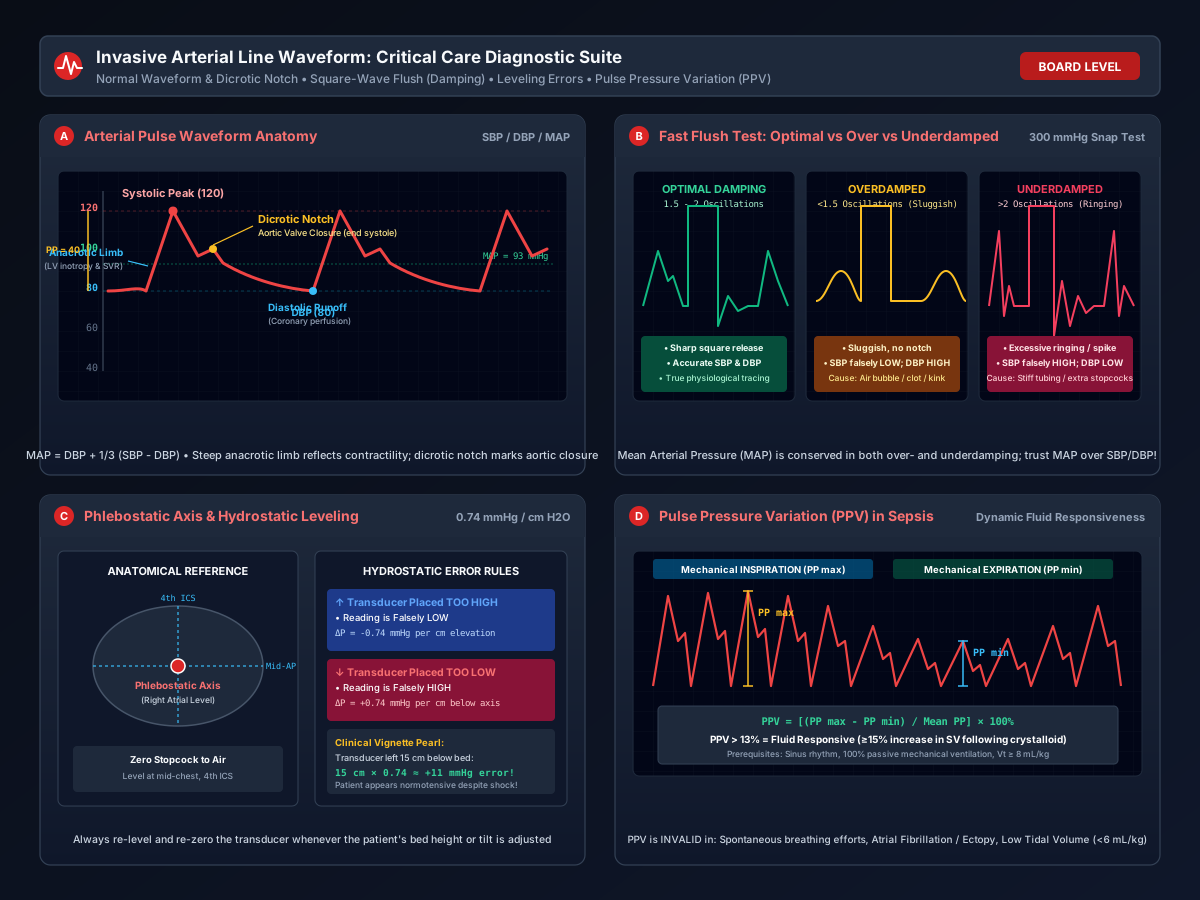
Four-panel critical care arterial line diagnostic suite: (A) Arterial pulse contour anatomy detailing systolic peak, anacrotic limb, dicrotic notch (aortic valve closure), and diastolic runoff; (B) Fast flush square-wave test comparing optimal damping (1.5-2 oscillations) with overdamped and underdamped systems; (C) Phlebostatic axis anatomical leveling at 4th ICS mid-AP diameter with hydrostatic error calculations; (D) Pulse Pressure Variation (PPV) tracing in mechanical ventilation predicting volume responsiveness (>13%).
“Invasive Arterial Line: Contour Anatomy, Fast Flush Damping, Leveling Errors, and Pulse Pressure Variation” by ClinInterpret Medical Education Editorial Board — CC BY 4.0. View Full Image.
Common Pitfalls & Diagnostic Traps
- Treating an 'elevated' systolic blood pressure with antihypertensives in an underdamped arterial line; always perform a fast flush test and inspect the MAP, which is unaffected by underdamping.
- Relying on Pulse Pressure Variation (PPV) in a patient with atrial fibrillation or frequent premature ventricular contractions (PVCs); irregular R-R intervals destroy the respiratory preload cycle and invalidate PPV.
- Using PPV on lung-protective low tidal volume ventilation (6 mL/kg); tidal volumes <8 mL/kg do not generate sufficient intrathoracic pressure swings to elicit significant heart-lung interaction, producing false-negative PPV.
- Failing to re-zero and re-level the arterial transducer after changing patient bed height, Fowler angle, or transporting from operating room to ICU.
1Overview and Physiology
Continuous invasive arterial blood pressure monitoring via indwelling peripheral arterial catheterization (radial, femoral, axillary, or dorsalis pedis) is the clinical gold standard for beat-to-beat hemodynamic assessment in critically ill patients and high-risk surgical operations.
2Vascular Biomechanics and Pressure Waveform Propagation
The arterial pressure wave recorded by a transducer is not a simple column of blood, but a complex hydraulic acoustic wave initiated by left ventricular stroke volume ejection into the viscoelastic aorta:
- Forward Incident Wave: Left ventricular systole accelerates blood into the proximal ascending aorta, creating an initial high-velocity pressure wavefront that travels down the arterial tree at 5 to 10 m/s (significantly faster than the physical velocity of red blood cells, which travel at <1 m/s).
- Reflected Backward Wave: As the incident pressure wave reaches peripheral arterial branch points, caliber changes, and high-resistance arteriolar beds, reflections bounce backward toward the central aorta.
- Peripheral Distortions (Radial vs Aortic Pressure):
- Central aortic waveforms exhibit lower peak systolic pressures, higher diastolic pressures, and a prominent mid-systolic dicrotic notch.
- As the wave travels peripherally to the radial or dorsalis pedis artery, high vascular impedance causes systolic amplification: the peripheral systolic peak is $10\text{--}20\ \text{mmHg}$ higher, the pulse pressure is wider, but the Mean Arterial Pressure (MAP) is $1\text{--}3\ \text{mmHg}$ lower due to viscous energy dissipation.
3Recording and Calibration
An indwelling arterial catheter is coupled to a piezoresistive Wheatstone bridge diaphragm transducer via non-compliant, fluid-filled high-pressure tubing pressurized to 300 mmHg with a continuous flush rate of 3 mL/h of heparinized or sterile normal saline.
4Physical Resonance and Natural Frequency ($f_n$)
The fluid-filled transducer system behaves as a second-order harmonic oscillator characterized by two physical constants:
- Natural Undamped Frequency ($f_n$): The frequency at which the system oscillates freely when stimulated. In clinical practice, fₙ must exceed $>20\text{--}25\ \text{Hz}$ to avoid harmonic overlap with the patient's fundamental heart rate (1--3 Hz) and its first 5 to 8 harmonics.
- Damping Coefficient ($\zeta$): The rate at which the system dissipates frictional kinetic energy. The optimal clinical damping coefficient is $\zeta \approx 0.5\text{--}0.7$.
5The Fast Flush (Square Wave) Test
The fast flush test is performed by opening the high-pressure flush valve for 1 second and releasing it instantaneously:
- Optimal Damping: The square wave returns to baseline within 1.5 to 2 rapid oscillations, indicating accurate reproduction of peak systolic and end-diastolic pressures.
- Overdamping ($\zeta > 0.8$): The system absorbs excessive energy. The tracing returns sluggishly to baseline without any undershoot or rebound oscillation (<1.5 oscillations).
- Effect on Pressures: Peak systolic pressure is falsely LOW, diastolic pressure is falsely HIGH, pulse pressure is narrowed, and the dicrotic notch is blunted or absent.
- Causes: Air bubbles in the tubing or transducer dome (air is compressible), blood clot at the catheter tip, compliant/soft tubing, arterial wall impingement, or multiple stopcock extensions.
- Underdamping ($\zeta < 0.4$, Resonance): The system rings excessively. The square wave displays >2 oscillations with deep undershoot and repeated bouncing.
- Effect on Pressures: Peak systolic pressure is falsely HIGH (by up to 20--30 mmHg), diastolic pressure is falsely LOW, and pulse pressure is artificially widened.
- Causes: Rigid/stiff tubing, long extension lines (>1.5 meters), multiple stopcock manifolds, hypothermia, or catheter whipping in hyperdynamic states.
6Normal Pattern
A normal, well-damped radial arterial waveform consists of four distinct physiological phases:
    Pressure (mmHg)
    120 ┬                     Systolic Peak
        │                          ▲
    100 ┼                         ╱ ╲
        │       Anacrotic Limb   ╱   ╲
     80 ┼ - - - - - - - - - - - ╱     ╲   ╭─ Dicrotic Notch (Aortic Valve Closure)
        │                      ╱       ╲ ╱ ╲
     60 ┼                     ╱         v   ╲  Diastolic Runoff
        │                    ╱               ╲
     40 ┴───────────────────╯                 ╰────────────────
Diastolic Baseline- Anacrotic Limb: The steep initial upstroke of ventricular systole. The slope (Δ P / Δ t) reflects left ventricular contractility (inotropy) and systemic vascular resistance (SVR).
- Systolic Peak: The maximal pressure during ventricular ejection, reflecting stroke volume, aortic wall compliance, and vascular impedance.
- Dicrotic Notch (Incisura): A sharp, discrete indentation on the descending limb caused by the sudden physical closure of the aortic valve leaflets, marking the end of mechanical systole and onset of ventricular diastole.
- Diastolic Runoff: A smooth, exponential downward curve representing elastic aortic recoil pushing blood through peripheral microvascular beds and coronary arteries during diastole.
7Measurement Method
81. Phlebostatic Axis Zeroing and Leveling
- Anatomical Landmark: The transducer's air-fluid zeroing stopcock must be positioned at the Phlebostatic Axis, defined as the intersection of the 4th intercostal space and the midpoint of the anterior-posterior chest diameter (representing the physiological level of the right atrium).
- Hydrostatic Fluid Column Physics:
$Δ P = rho × g × Δ h ≈ 0.74 mmHg per 1 cm H₂O$
- If the transducer is positioned $10\ \text{cm}$ above the axis: the measured pressure is $7.4\ \text{mmHg}$ falsely LOW.
- If the transducer is positioned $10\ \text{cm}$ below the axis: the measured pressure is $7.4\ \text{mmHg}$ falsely HIGH.
92. Pulse Pressure Variation (PPV) Calculation
Pulse pressure (PP) is calculated as SBP - DBP. Over a single mechanical respiratory cycle (typically 3 to 5 breaths): $PPV (%) = frac{PP_max - PP_min}{(PP_max + PP_min) / 2} × 100$
- Cutoff: PPV > 12--13% identifies patients on the steep ascending limb of the Frank-Starling curve who will increase cardiac output by ≥ 15% in response to a fluid challenge.
10Indications
- Hemodynamic Instability and Shock: Continuous real-time titration of intravenous vasopressors (norepinephrine, vasopressin) and inotropes (epinephrine, dobutamine) in septic, cardiogenic, or hemorrhagic shock.
- Frequent Arterial Blood Gas Sampling: Patients with severe respiratory failure (ARDS) requiring serial acid-base and oxygenation tracking.
- Induced Hypotension or Induced Hypertension: Target MAP titration in acute ischemic stroke (140--180 mmHg) or acute aortic dissection (<100--120 mmHg SBP).
- Dynamic Fluid Responsiveness Assessment: Real-time evaluation of Pulse Pressure Variation (PPV) and Stroke Volume Variation (SVV) in mechanically ventilated surgical and septic patients.
- Non-Invasive Cuff Inaccuracy: Severe peripheral edema, morbid obesity, or severe vasoconstriction where oscillometric cuffs fail.
11Systematic Interpretation Steps
Step 1: Check Technical Setup and Zero
   ├─ Verify transducer is leveled to phlebostatic axis (4th ICS mid-AP diameter)
   └─ Ensure system has been zeroed to atmospheric air

Step 2: Perform Fast Flush Test
   ├─ Snap flush valve for 1 second: count oscillations after square wave
   ├─ If <1.5 oscillations: System is OVERDAMPED (check for air bubbles, blood clots, kinks)
   ├─ If >2.0 oscillations: System is UNDERDAMPED (remove stopcocks, use rigid short tubing)
   └─ If optimal (1.5-2 oscillations): SBP and DBP are diagnostic

Step 3: Analyze Arterial Pulse Contour
   ├─ Inspect anacrotic slope (steep = hyperdynamic; flat = severe aortic stenosis or poor inotropy)
   ├─ Verify presence and position of Dicrotic Notch
   └─ Correlate SBP, DBP, and calculated MAP

Step 4: Evaluate Respiratory Variation (PPV)
   ├─ Verify sinus rhythm (NO atrial fibrillation)
   ├─ Verify 100% passive mechanical ventilation (zero patient trigger efforts)
   ├─ Verify tidal volume >= 8 mL/kg predicted body weight
   └─ Calculate PPV: If >13%, patient is fluid responsive

Step 5: Clinical Hemodynamic Synthesis
   ├─ Low SBP + Low DBP + Steep slope = Vasodilatory shock (sepsis)
   ├─ High SBP + Normal DBP + Underdamped ringing = Resonance artifact (trust MAP!)
└─ Pulsus alternans (alternating strong and weak beats) = Severe LV systolic failure12Abnormal Patterns and Differential Diagnosis
$begin{array}{|l|l|l|} hline textbf{Waveform Pattern} & textbf{Morphological Characteristics} & textbf{Etiology & Clinical Significance} \ hline textbf{Pulsus Tardus et Parvus} & Slurred, delayed anacrotic upstroke with low peak & Severe Aortic Valve Stenosis; fixed outflow obstruction \ textbf{Pulsus Bisferiens} & Double systolic peak per single cardiac cycle & Combined Aortic Regurgitation + Stenosis, or HOCM \ textbf{Pulsus Alternans} & Regular rhythm with alternating high and low pulse beats & Severe end-stage Left Ventricular Systolic Heart Failure \ textbf{Pulsus Paradoxus} & text{Exaggerated SBP drop (>10\text{ mmHg}) during spontaneous inspiration} & Cardiac Tamponade, severe status asthmaticus, constrictive pericarditis \ textbf{High PPV (>13\%)} & Significant respiratory swing in PP on passive ventilation & Hypovolemia, preload dependence (fluid responsive) \ textbf{Overdamped Waveform} & Blunted peak, lost dicrotic notch, sluggish flush & Air bubble in line, clot at catheter tip, compliant soft tubing \ textbf{Underdamped Waveform} & Spike overshoot, excessive ringing, false high SBP & Resonance artifact, stiff catheter, hypothermia, catheter whip \ hline end{array}$
13Limitations and Pitfalls
- The MAP Invariance Rule: While underdamping elevates SBP and overdamping lowers SBP, Mean Arterial Pressure (MAP) is remarkably resilient to damping artifacts. When in doubt, base clinical vasopressor titration on MAP, not SBP!
- PPV Applicability Criteria: PPV is completely invalid in:
- Spontaneous breathing efforts (even subtle patient triggering creates irregular intrathoracic pressure swings).
- Arrhythmias (atrial fibrillation, frequent premature ventricular contractions vary stroke volume beat-to-beat).
- Low tidal volume ventilation (<6--8 mL/kg in ARDS does not produce sufficient heart-lung interaction).
- Right ventricular failure (cor pulmonale produces high PPV that does NOT respond to volume).
- Open chest conditions (thoracotomy abolishes intrathoracic pressure swings).
14Critical Findings and Red Flags
> [!CAUTION] > Emergency Escalation Triggers: > 1. Damped Waveform with Inability to Aspirate Blood: Immediately inspect catheter site. Never forcefully flush a non-aspirating arterial line, as this can dislodge a retrograde thrombus into the vertebral or cerebral circulation! > 2. Pulsus Paradoxus $>10\ \text{mmHg}$ in Trauma or Pericardial Disease: Immediate bedside echocardiogram to rule out acute cardiac tamponade. > 3. Discrepancy Between Arterial Line and Clinical State: If the monitor reads severe hypotension but the patient is alert and warm, inspect the transducer height immediately—a transducer positioned high on an IV pole will simulate profound shock.
15Exam Pearls
- The Air Bubble Rule: A microscopic air bubble (0.05 mL) is 10,000 times more compliant than water, instantly transforming a crisp, underdamped arterial line into a severely overdamped tracing. Always inspect the transducer dome with an alcohol swab.
- Peripheral Pulse Steeper than Central: Radial SBP is higher than central aortic SBP due to wave reflection, but MAP is virtually identical. If you need to know the true coronary perfusion pressure, trust the radial MAP.
- Pulsus Paradoxus vs Reverse Pulsus Paradoxus:
- Spontaneous breathing: Inspiration lowers intrathoracic pressure → drops SBP (normal <10 mmHg; >10 mmHg is pulsus paradoxus in tamponade).
- Positive pressure mechanical ventilation: Inspiration raises intrathoracic pressure → increases SBP (reverse pulsus paradoxus). This is the physiological engine that drives PPV!
Related Investigations & Companion Tests
Attributed Textbooks & Clinical Guidelines
- Marino PL. Marino's The ICU Book. 4th ed. Wolters Kluwer Health/Lippincott Williams & Wilkins, 2014
- Michard F et al. Clinical use of respiratory changes in arterial pulse pressure to monitor the hemodynamic effects of PEEP. Am J Respir Crit Care Med. 1999;159(3):935-939
- McGhee BH, Bridges EJ. Monitoring arterial blood pressure: what you may not know. Crit Care Nurse. 2002;22(2):60-79
- Vincent JL et al. Textbook of Critical Care. 8th ed. Elsevier, 2023
What are the anatomical components of a normal invasive arterial line pulse contour, and what does the dicrotic notch signify?
Notes & Highlights
Saved locally onlyA 64-year-old male in septic shock is monitored via a right radial arterial catheter. The bedside monitor displays an invasive blood pressure of 145/52 mmHg (MAP 83 mmHg). The intensivist suspects artifactual distortion and performs a high-pressure fast flush test: the flush creates a square wave followed by four rapid, high-frequency oscillations that overshoot and ring before returning to baseline. The arterial waveform displays a narrow, exaggerated spike at the systolic peak. What is the physical artifact, and what is the true hemodynamic state?
A 55-year-old female in the intensive care unit is intubated and mechanically ventilated in volume control mode (tidal volume 8 mL/kg, zero spontaneous efforts, sinus rhythm, HR 85 bpm). During inspiration, arterial systolic pressure rises and pulse pressure widens to 54 mmHg (PPmax). During expiration, pulse pressure falls to 36 mmHg (PPmin). Blood pressure is 98/55 mmHg (MAP 69 mmHg), and urine output is 0.3 mL/kg/h. What is the calculated Pulse Pressure Variation (PPV), and what is the indicated hemodynamic intervention?
An ICU nurse adjusts a patient's bed from completely flat (supine) to a 45-degree semi-Fowler position to prevent ventilator-associated pneumonia. The arterial line transducer remains mounted on the bedside IV pole at its previous height. The monitor immediately alarms, displaying an apparent drop in blood pressure from 120/75 mmHg (MAP 90 mmHg) to 98/53 mmHg (MAP 68 mmHg). Physical assessment shows the patient is warm, alert, with strong peripheral pulses and normal capillary refill. What is the cause of this acute blood pressure change?